User Statistics
The user statistics section list down the count of activities done by the client so far.It list down the count of clients assigned, quotations booked ,manual offers ,and system offers. To get a statistical representation on these counts you can click on the view button which will display all these counts in a graphical format.
When you go to the view page it displays four tabs –
- Searched Quotations
- Manual Quotations
- Manual Offers
- System Offers
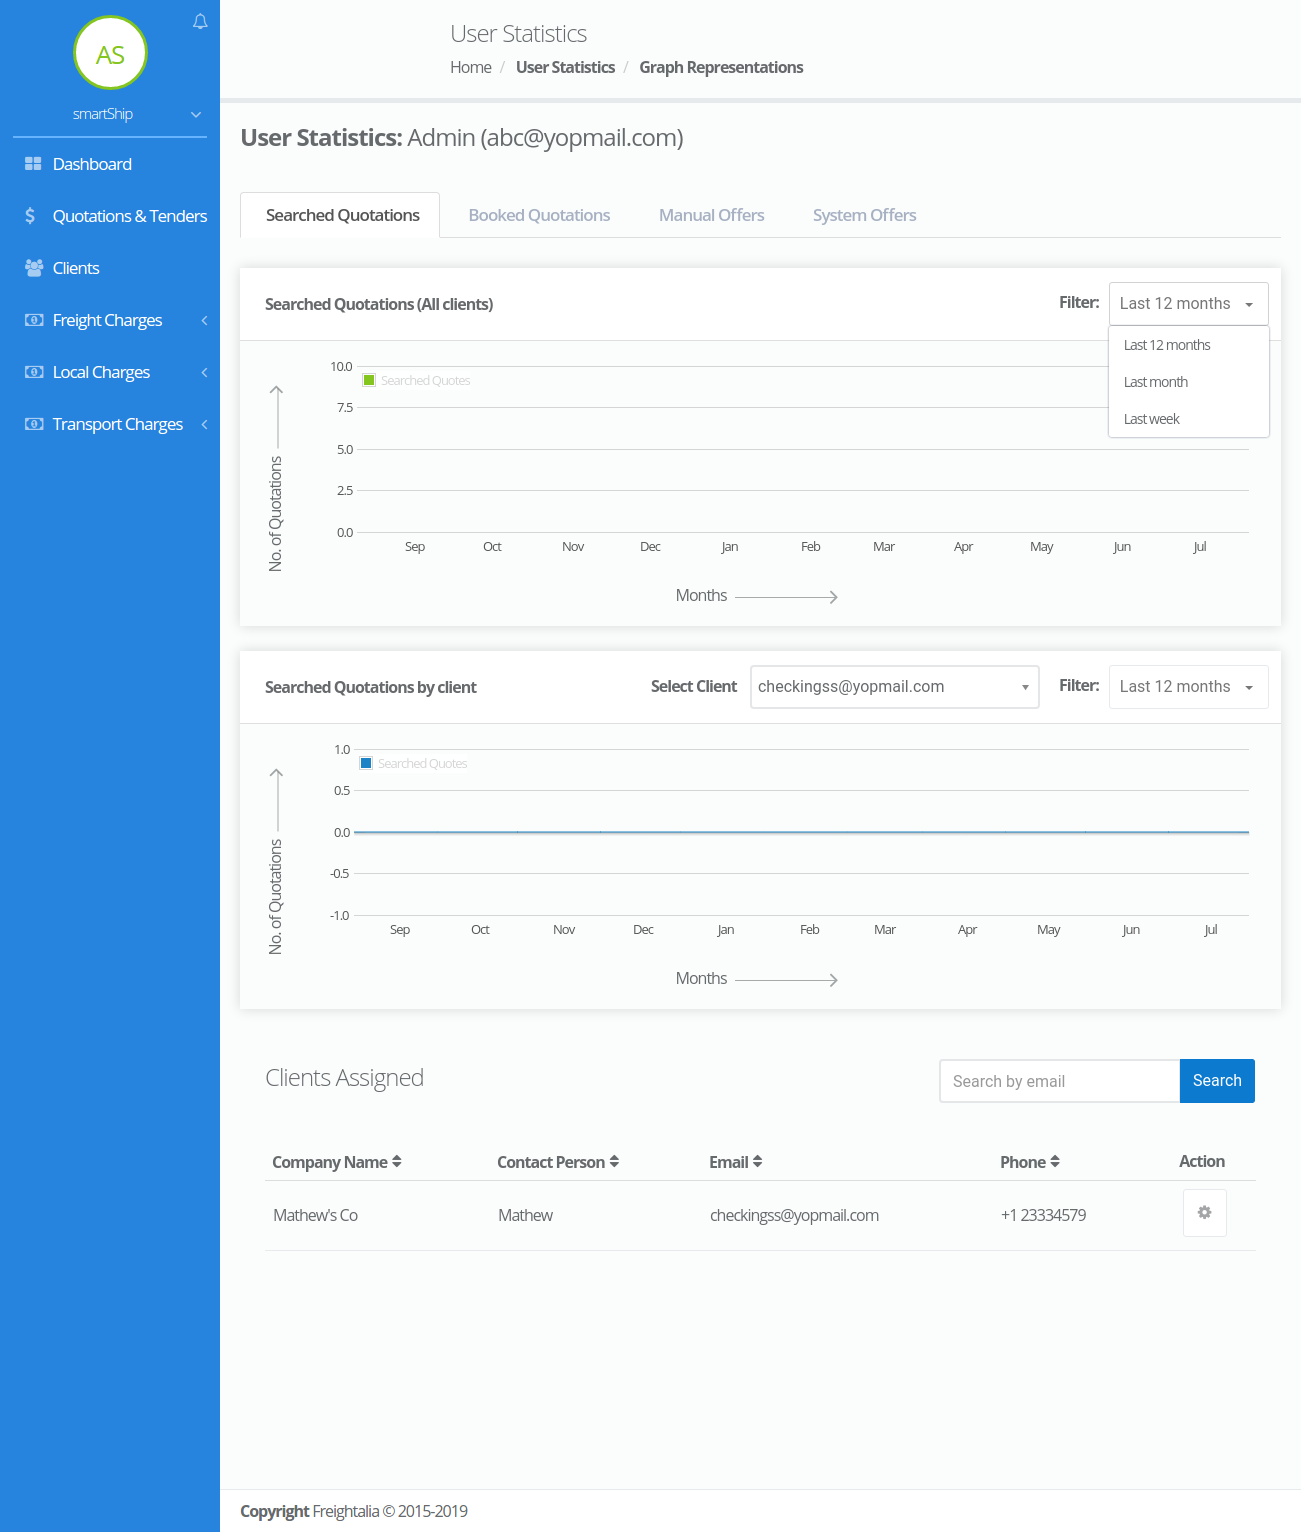
Searched Quotations – This tab displays the statistics of the quotations searched by all the clients assigned to the selected user on the first graph. The graph just below it displays the quotation searched by specific client of the user .In order to check the statistics for another client you can select the desired client from the list of clients assigned just given below it .Also the graphs are provided with filter from where you can change the time limit.
Please refer the image given below.
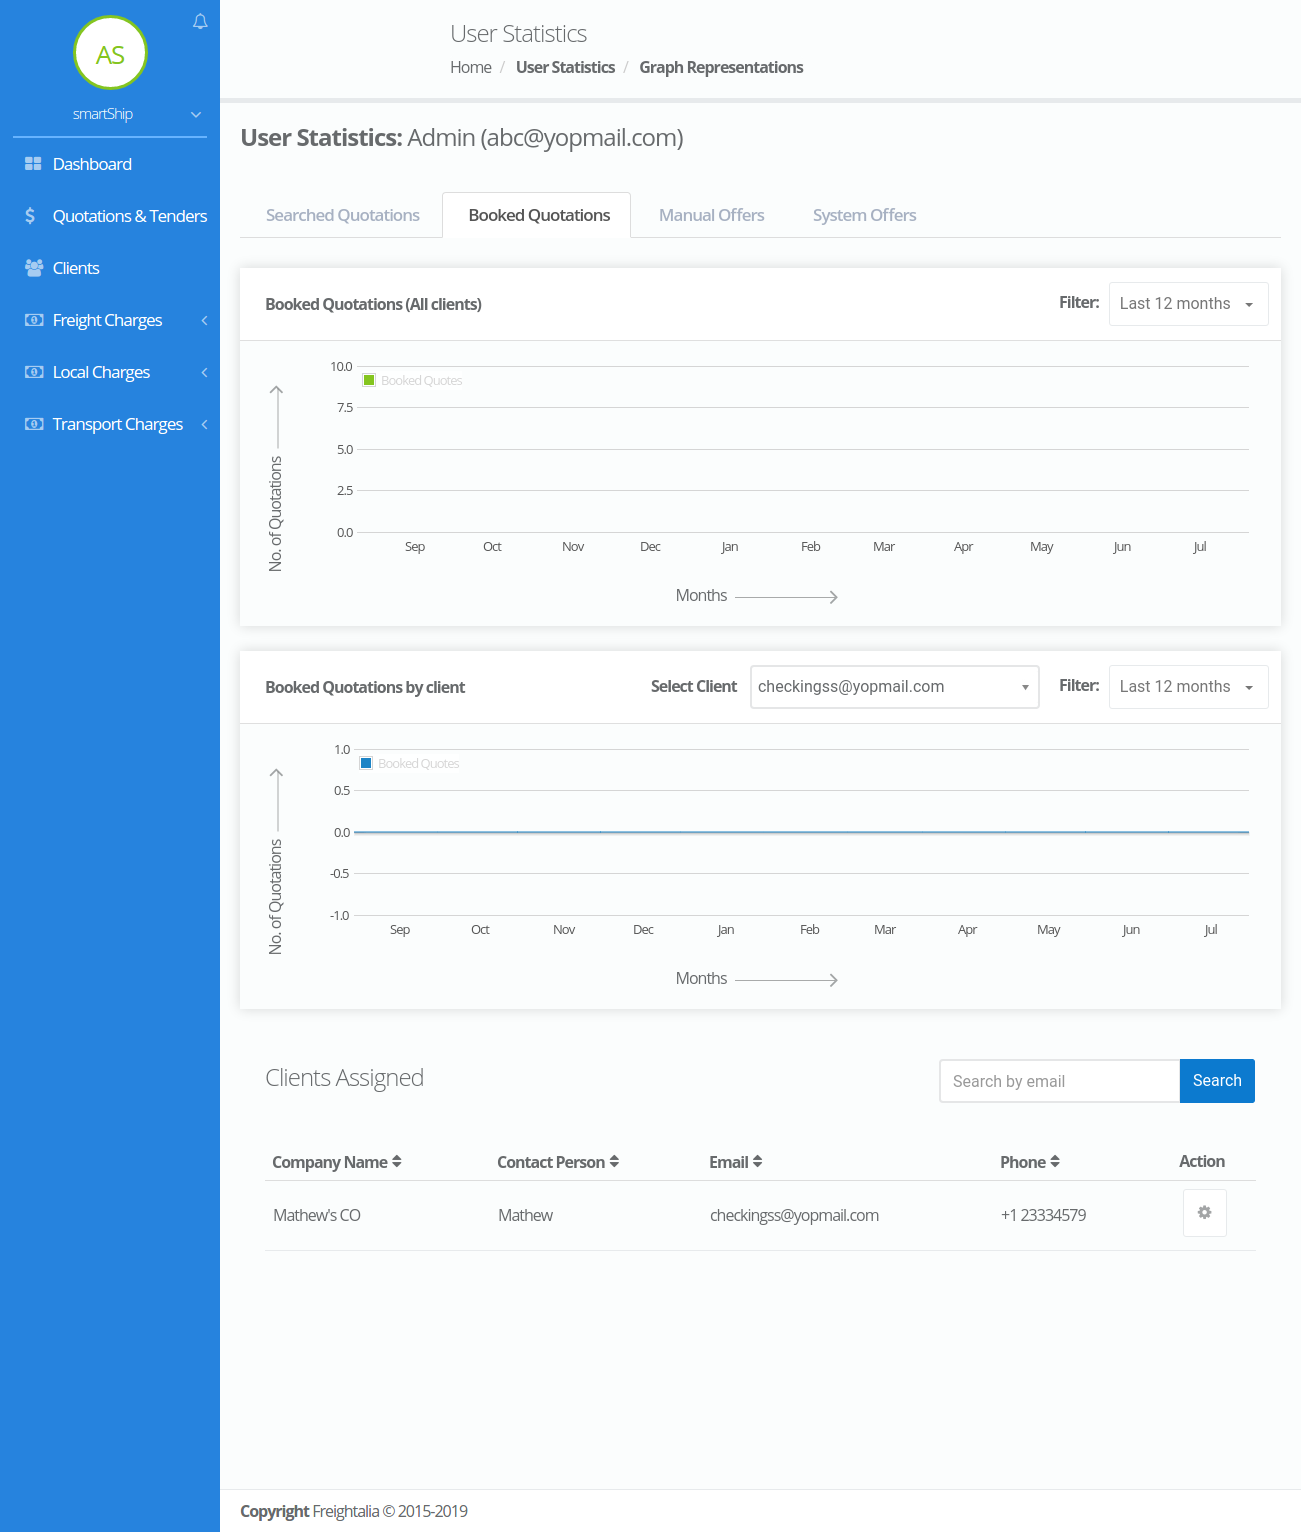
Booked Quotations – This tab displays the statistics of the quotations booked by all the clients assigned to the selected user on the first graph. The graph just below it displays the quotation booked by specific client of the user .In order to check the statistics for another client you can select the desired client from the list of clients assigned just given below it .Also the graphs are provided with filter from where you can change the time limit.
Please refer the image given below.
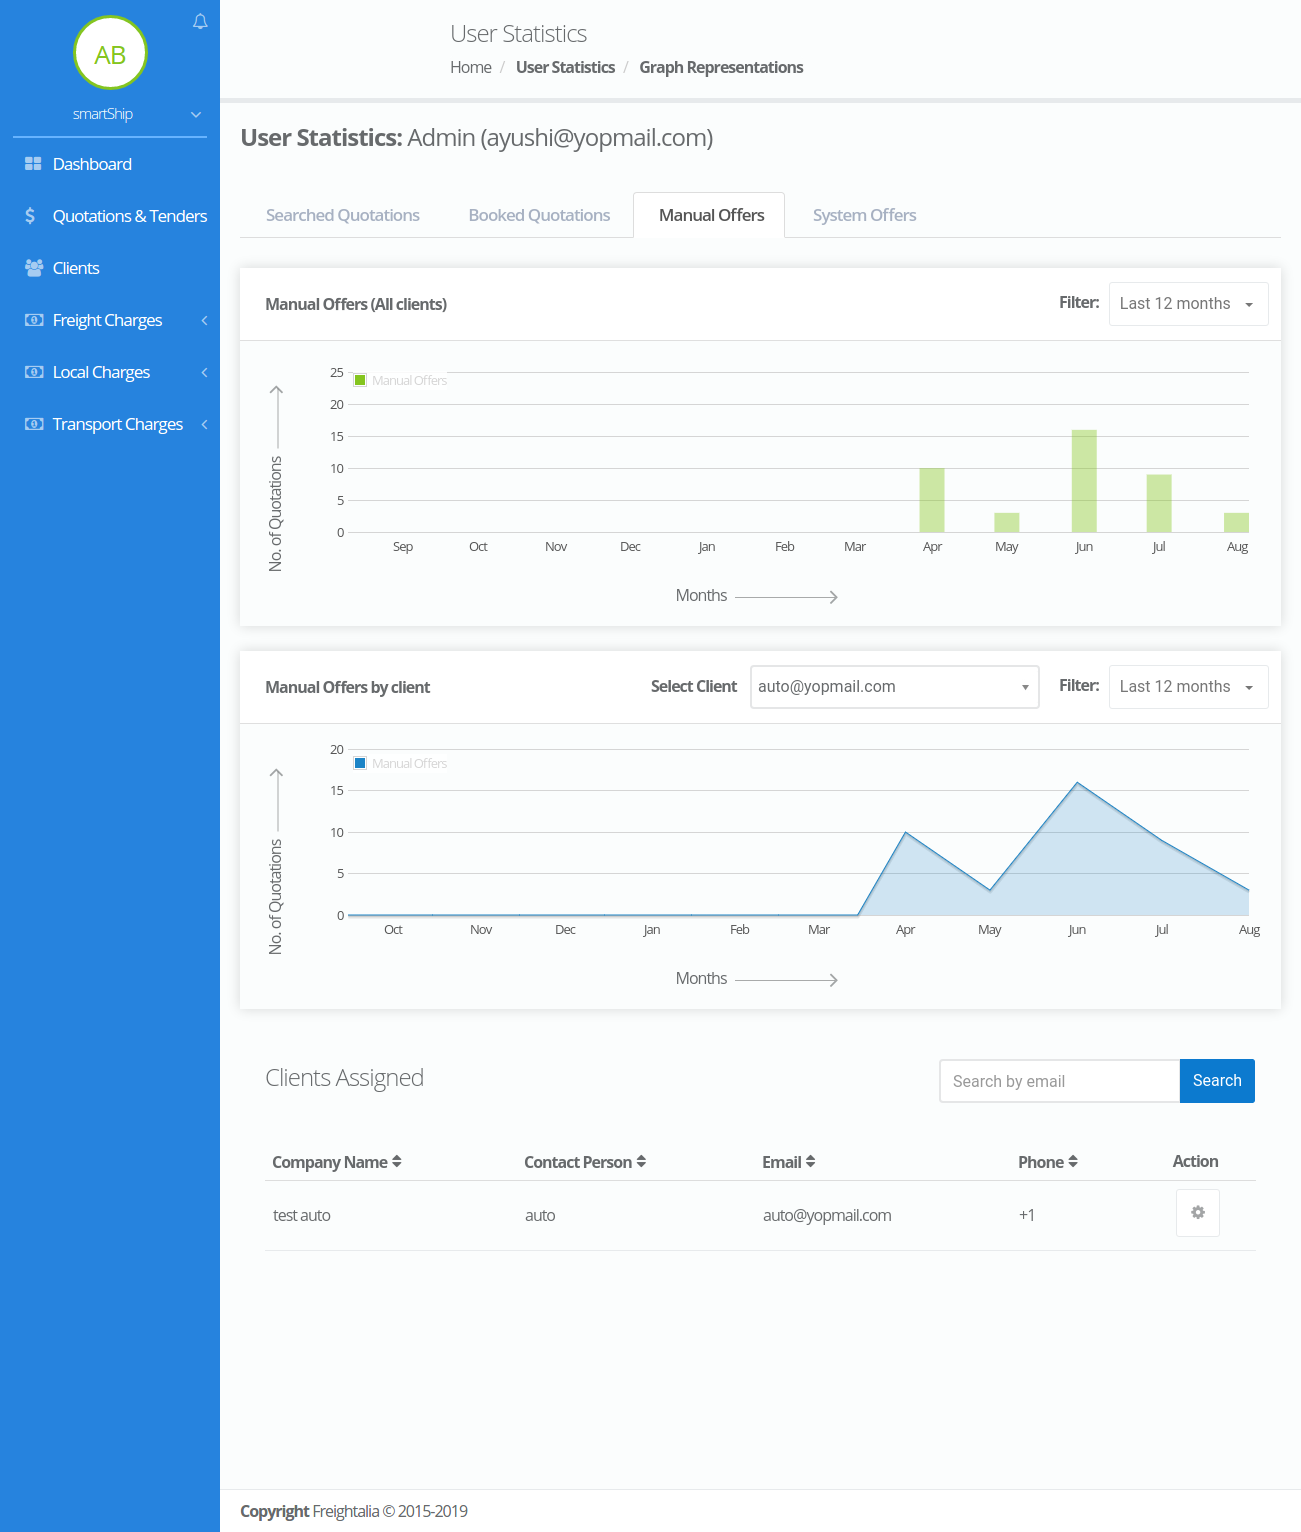
Manual Offers – This tab displays the manual offers generated from the admin panel for all the clients assigned to the selected user on the first graph. The graph just below it displays the manual offers generated for the specific client of the user .In order to check the statistics for another client you can select the desired client from the list of clients assigned just given below it .Also the graphs are provided with filter from where you can change the time limit.
Please refer the image given below.
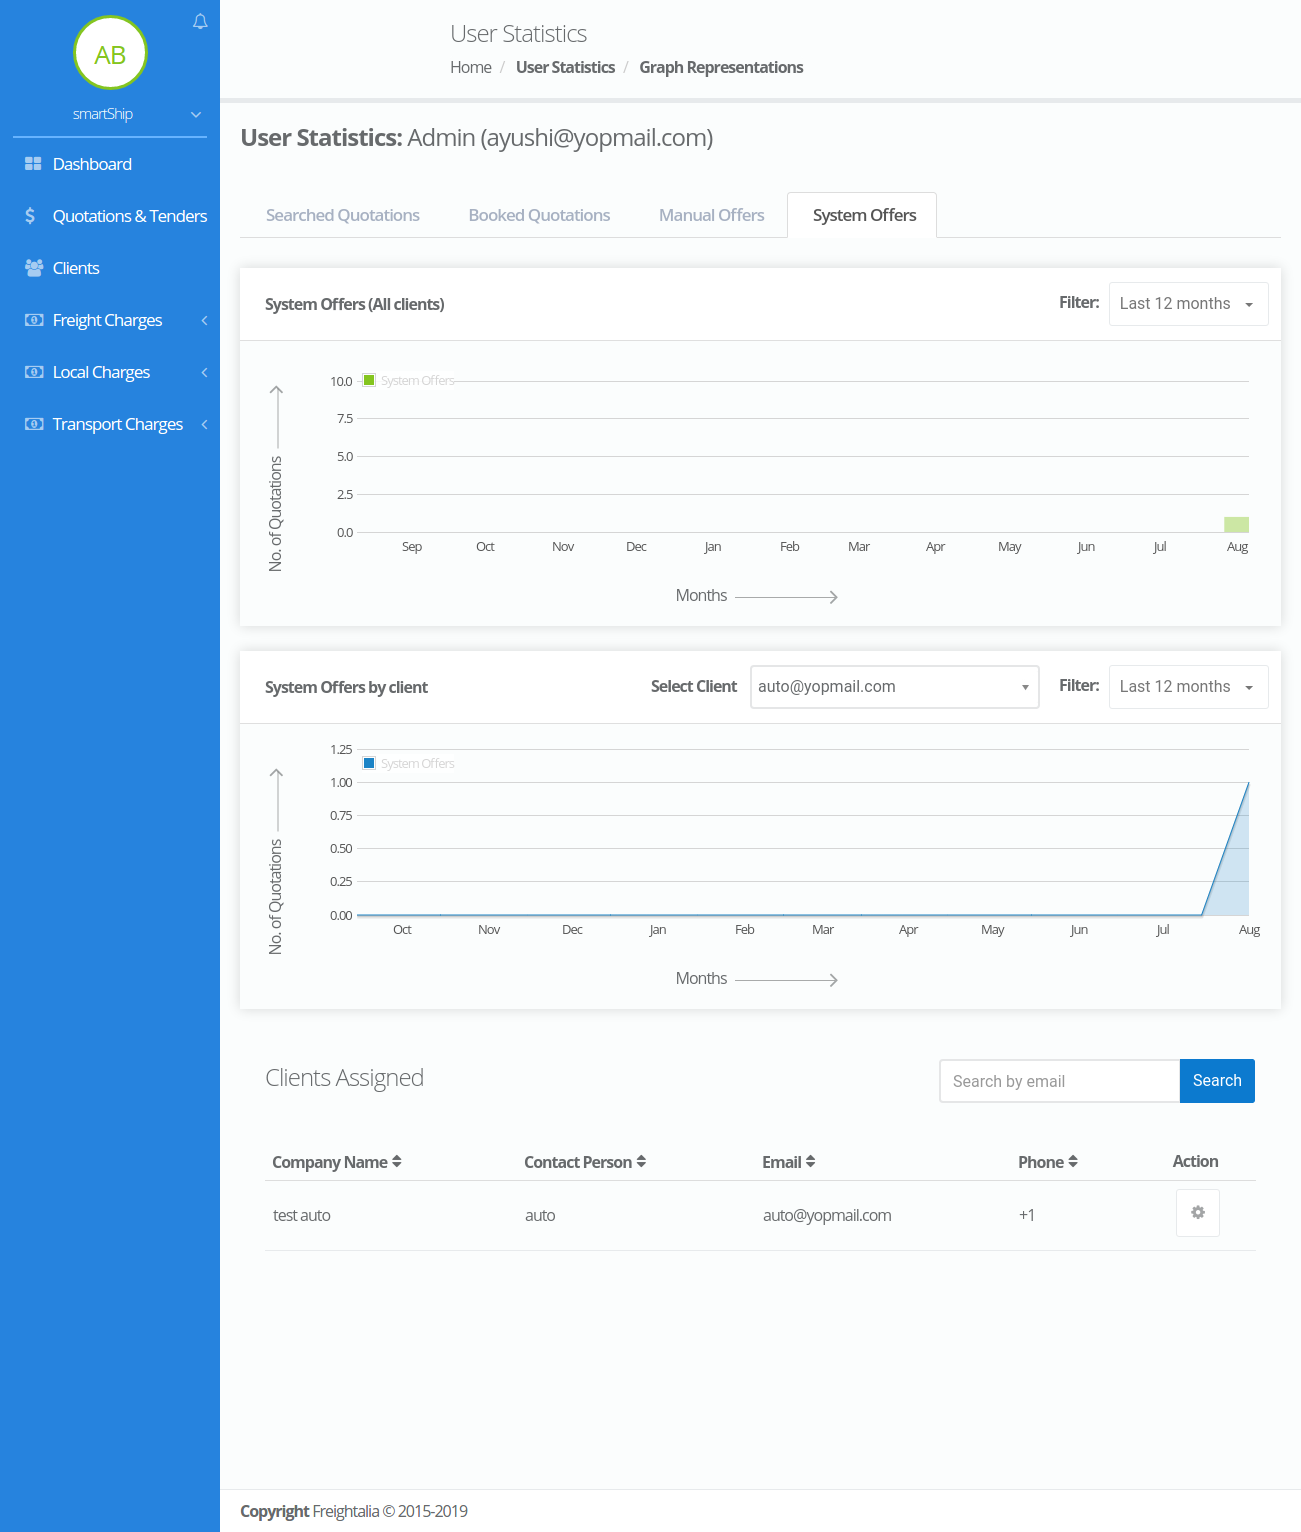
System Offers – This tab displays the system offers generated by all the clients assigned to the selected user on the first graph. The graph just below it displays the system offers generated by the specific client of the user .In order to check the statistics for another client you can select the desired client from the list of clients assigned just given below it .Also the graphs are provided with filter from where you can change the time limit.
Please refer the image given below.